
Data Strategy
With the rise of passive investing, incorporating an index rebalancing strategy is becoming essential for Chief Investment Officers today. As the benchmark in the index rebalance space, Intropic can provide you with the data you need to make your strategy a success.
Our Platforms
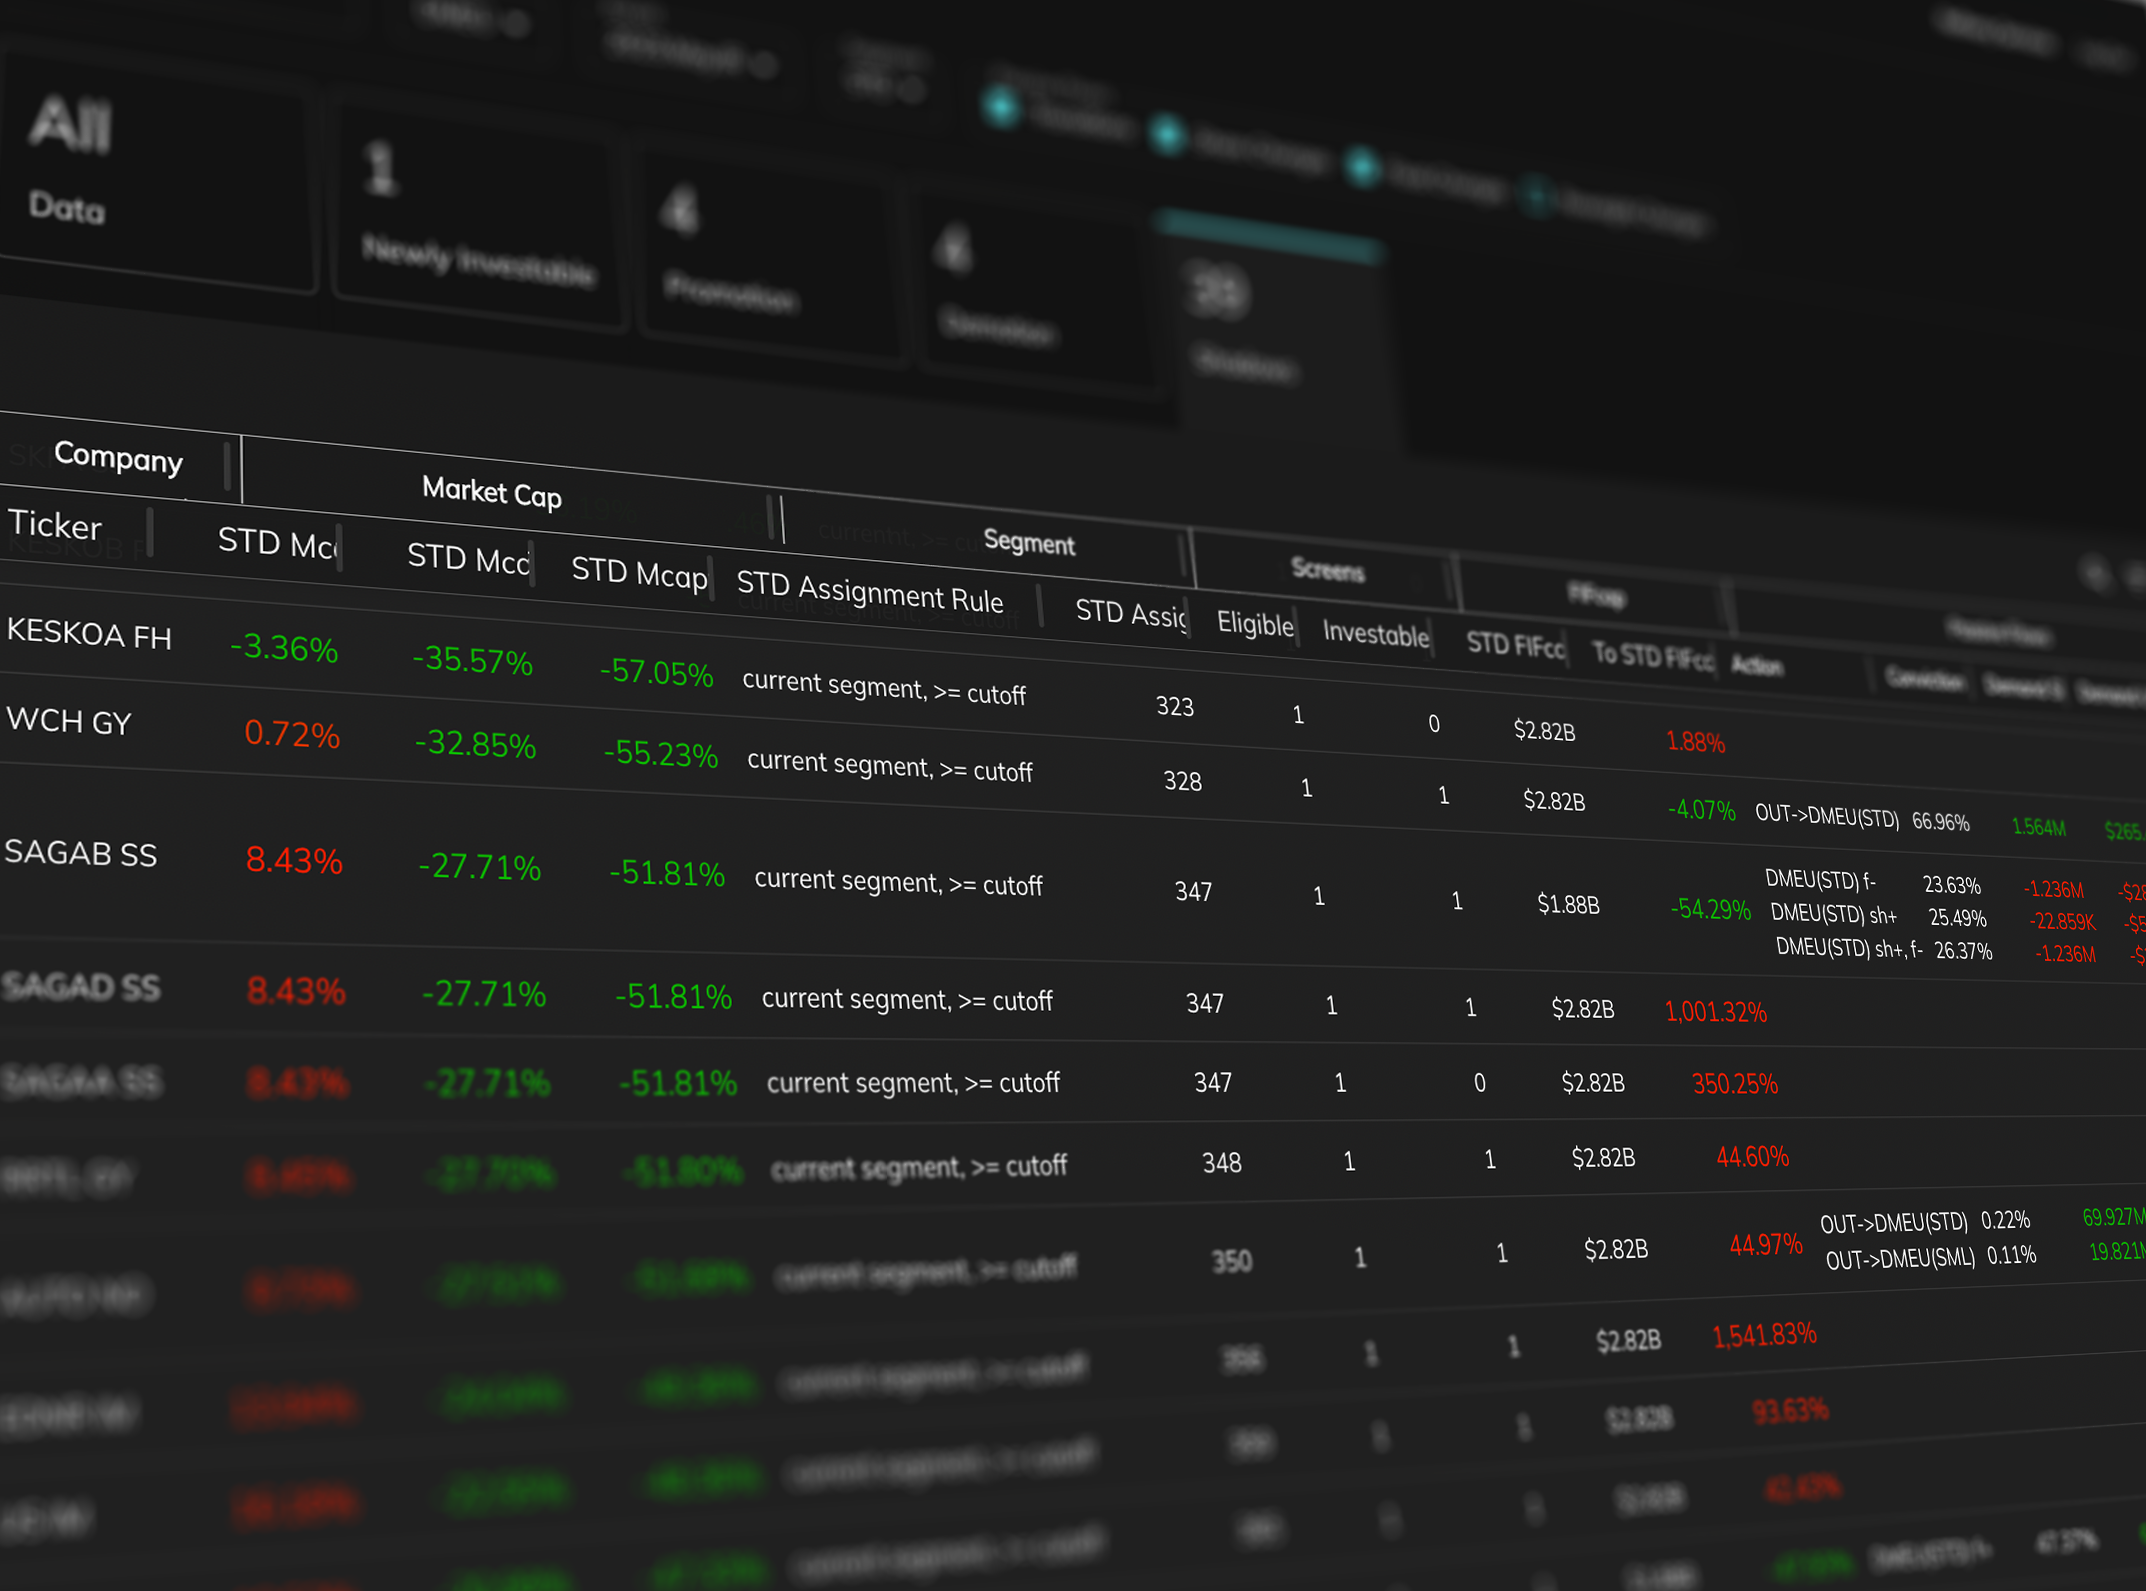
Index Intelligence
Elevate your index rebalancing strategies with Index Intelligence, providing in-depth insights into the why and how behind our conviction scores.
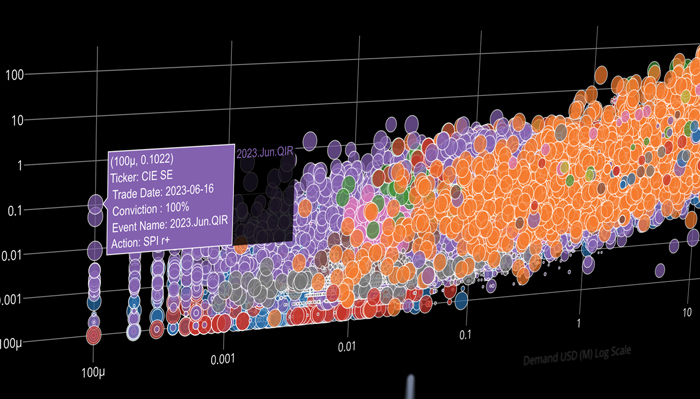
Passive fund intelligence
Quantitative conviction scores forecasting the impact of scheduled index rebalances on securities up to 12 months ahead for alpha and trade ideas.
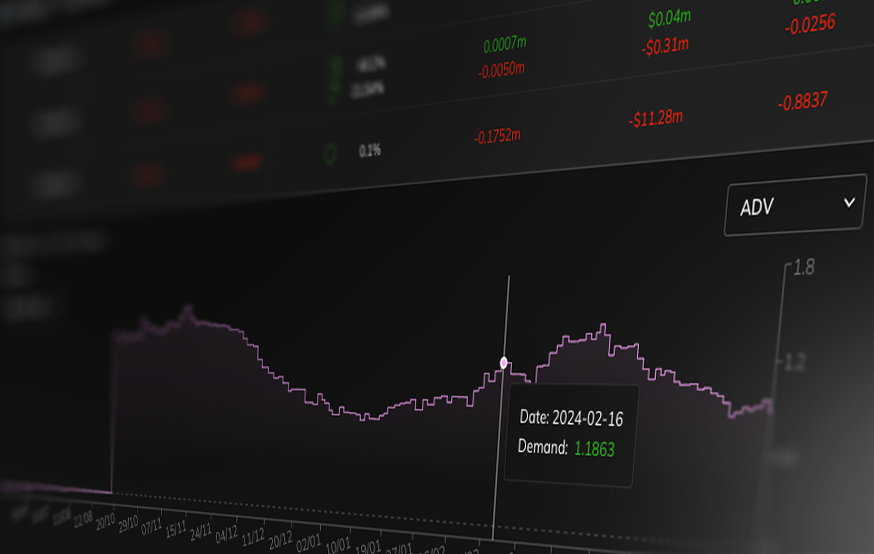
Fund Flows
For non-specialists who want to enhance their investment process and trading strategies with valuable insights into fund flows.
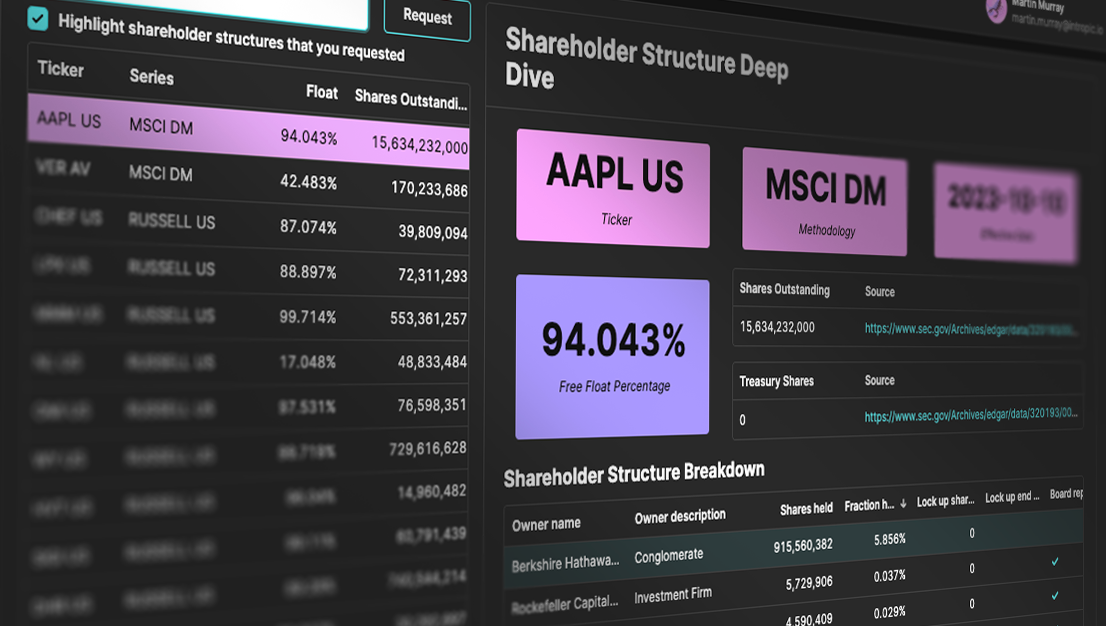
Shareholder Structure
Passive investments, a third of market activity, are mostly tied to $15 trillion in assets via market cap weighted indices, using subjective measures to classify shareholders as restricted or free.
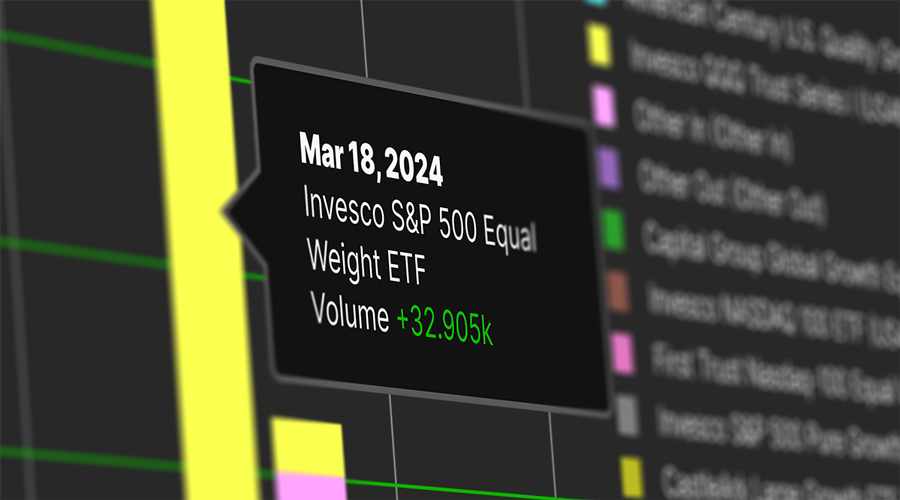
ETF Intelligence
Meet ETF Intelligence, our platform simplifies daily ETF tracking and explores their holdings, providing insight into compositions and stock movements for confident decision-making.
Corporate Action Intelligence
Meet ETF Intelligence, our platform simplifies daily ETF tracking and explores their holdings, providing insight into compositions and stock movements for confident decision-making.
Our Platforms
Index Intelligence
Elevate your index rebalancing strategies with Index Intelligence, providing in-depth insights into the why and how behind our conviction scores.
Passive fund intelligence
Quantitative conviction scores forecasting the impact of scheduled index rebalances on securities up to 12 months ahead for alpha and trade ideas.
Fund Flows
For non-specialists who want to enhance their investment process and trading strategies with valuable insights into fund flows.
Shareholder Structure
Passive investments, a third of market activity, are mostly tied to $15 trillion in assets via market cap weighted indices, using subjective measures to classify shareholders as restricted or free.
ETF Intelligence
Meet ETF Intelligence, our platform simplifies daily ETF tracking and explores their holdings, providing insight into compositions and stock movements for confident decision-making.
Corporate Action Intelligence
Meet ETF Intelligence, our platform simplifies daily ETF tracking and explores their holdings, providing insight into compositions and stock movements for confident decision-making.